Refer to the graph below. 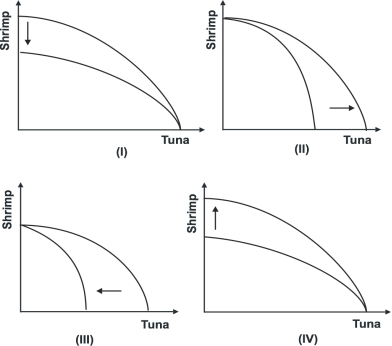 Which of the shifts explains what would happen to the production possibility curve if restrictions were imposed on tuna fishing?
A) I
B) II
C) III
D) IV
Correct Answer:
Verified
Q42: Laissez-faire is an economic:
A) theorem because it
Q48: Which of the following is the best
Q49: Refer to the graph below. 
Q49: If a country takes advantage of the
Q51: Refer to the graphs shown.The discovery of
Q52: According to Adam Smith, individuals are directed
Q53: Refer to the graph below.
Q57: In election campaigns, presidents often promise more
Q58: Refer to the graph below.
Q59: Refer to the graph below.
Unlock this Answer For Free Now!
View this answer and more for free by performing one of the following actions

Scan the QR code to install the App and get 2 free unlocks

Unlock quizzes for free by uploading documents