In the graph shown, an upward shift in the WAS curve: 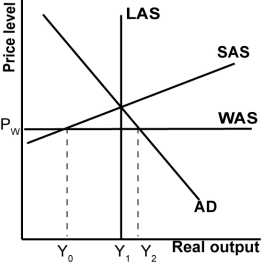
A) Raises domestic consumption because domestic producers produce more.
B) Lowers the trade deficit because domestic producers are more competitive.
C) Lowers domestic production because domestic consumption has fallen.
D) Raises globalized potential output because U.S.producers are less competitive.
Correct Answer:
Verified
Q61: In the early 2000s, policy makers were
Q71: The most likely explanation for why the
Q72: According to the structural stagnation hypothesis, the
Q73: In the graph shown, a shift in
Q74: In the graph shown, a downward shift
Q74: The gap between a country's potential output
Q81: Which group has fared the worst in
Q82: Suppose a young person asked you for
Q83: Which would help resolve structural stagnation?
A)Domestic exchange
Q110: Which of the following industries likely will
Unlock this Answer For Free Now!
View this answer and more for free by performing one of the following actions

Scan the QR code to install the App and get 2 free unlocks

Unlock quizzes for free by uploading documents