A professor of economics at a small Texas university wanted to determine what year in school students were taking his tough economics course.Shown below is a pie chart of the results.What percentage of the class took the course prior to reaching their senior year? 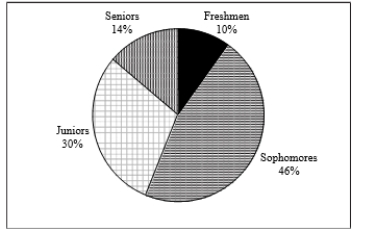
A) 14%
B) 44%
C) 54%
D) 86%
Correct Answer:
Verified
Q1: SCENARIO 2-5
The following are the duration
Q4: SCENARIO 2-2
2-2 Organizing and Visualizing Variables
At a
Q5: SCENARIO 2-1
An insurance company evaluates many numerical
Q7: SCENARIO 2-5
The following are the duration in
Q11: When constructing charts,the following is plotted at
Q12: SCENARIO 2-1
An insurance company evaluates many numerical
Q14: SCENARIO 2-5
The following are the duration in
Q15: SCENARIO 2-5
The following are the duration
Q18: SCENARIO 2-4
A survey was conducted to determine
Q19: SCENARIO 2-5
The following are the duration in
Unlock this Answer For Free Now!
View this answer and more for free by performing one of the following actions

Scan the QR code to install the App and get 2 free unlocks

Unlock quizzes for free by uploading documents