Given below is the scatter plot of the market value (thousands$) and profit (thousands$) of 50 U.S.companies.Higher market values appear to be associated with higher profits. 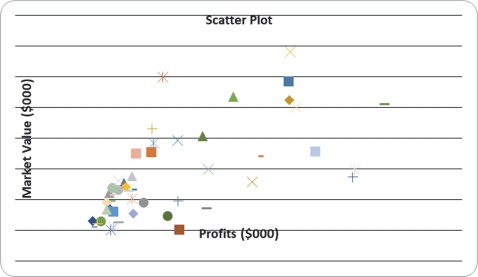
Correct Answer:
Verified
Q151: SCENARIO 2-17
The following table presents total retail
Q162: SCENARIO 2-18
The stem-and-leaf display below shows the
Q165: SCENARIO 2-17
The following table presents total retail
Q168: SCENARIO 2-18
The stem-and-leaf display below shows the
Q170: SCENARIO 2-18
The stem-and-leaf display below shows the
Q171: SCENARIO 2-18
The stem-and-leaf display below shows the
Q174: SCENARIO 2-18
The stem-and-leaf display below shows the
Q176: SCENARIO 2-18
The stem-and-leaf display below shows the
Q183: SCENARIO 2-16 The figure below is the
Q188: Given below is the scatter plot of
Unlock this Answer For Free Now!
View this answer and more for free by performing one of the following actions

Scan the QR code to install the App and get 2 free unlocks

Unlock quizzes for free by uploading documents