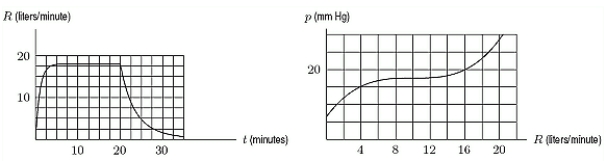
One of the graphs below shows the rate of flow, R, of blood from the heart in a man who bicycles for twenty minutes, starting at t = 0 minutes.The other graph shows the pressure, p, in the artery leading to a man's lungs as a function of the rate of flow of blood from the heart.Estimate
. 
A) 26.5
B) 23
C) 17.5
D) 13
Correct Answer:
Verified
Q33: Given the function
Q34: If the graph of y = f(x)is
Q35: The graph of y = f(x)is
Q36: Given the function
Q37: Given the function
Q39: In the book One Grain of Rice,
Q40: Give a possible formula for the function
Q41: The following describes a function that must
Q42: In 1909, the Danish biochemist Sören Peter
Q43: If the size of a bacteria colony
Unlock this Answer For Free Now!
View this answer and more for free by performing one of the following actions

Scan the QR code to install the App and get 2 free unlocks

Unlock quizzes for free by uploading documents