A pond has a population of 500 frogs.Over a ten-year period of time the number of frogs drops quickly by 20%, then increases slowly for 5 years before dropping to almost zero.Does the following graph accurately represent the number of frogs in the pond over the ten-year period of time? 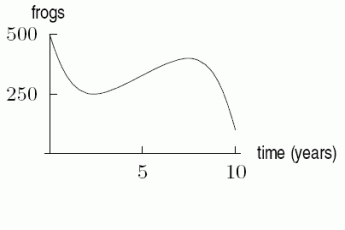
Correct Answer:
Verified
Q2: The following table defines three functions
Q3: On the
Q4: A school library opened in January of
Q5: Suppose the Long Island Railroad train from
Q6: Draw a graph which accurately represents the
Q8: The empirical function W = f(t), given
Q9: A bar of soap starts out at
Q10: Suppose we buy quantities
Q11: A school library opened in 1980.In January,
Q12: Suppose a 40
Unlock this Answer For Free Now!
View this answer and more for free by performing one of the following actions

Scan the QR code to install the App and get 2 free unlocks

Unlock quizzes for free by uploading documents