The cost C(q) (in dollars) of producing a quantity q of a certain product is shown in the graph below.The average cost is given by .Graphically, a(q) is the slope of the line between which two points? 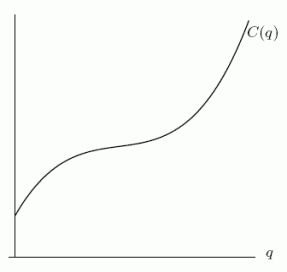
A) (0, 0)
B)
C) (0, q)
D)
Correct Answer:
Verified
Q42: The revenue for selling q items
Q43: A single cell of a bee's
Q44: Write a formula for total cost as
Q45: When light strikes a shiny surface,
Q46: The cost C(q)(in dollars)of producing a
Q48: Suppose f is a cubic function with
Q49: A rectangle is inscribed between the function
Q50: Total cost and revenue are approximated by
Q51: Consider the one-parameter family of functions
Q52: The revenue for selling q items
Unlock this Answer For Free Now!
View this answer and more for free by performing one of the following actions

Scan the QR code to install the App and get 2 free unlocks

Unlock quizzes for free by uploading documents