Multiple Choice
Figure 5.7 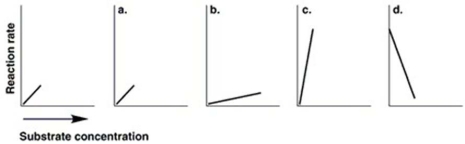 The graph at the left in Figure 5.7 shows the reaction rate for an enzyme at its optimum temperature. Which graph shows enzyme activity at a higher temperature?
A) a
B) b
C) c
D) d
Correct Answer:
Verified
Related Questions
Q21: Which of the following uses glucose for
Q25: Which of the following statements are TRUE?
Q26: In green and purple bacteria, electrons to
Q27: Which of the following uses Co2 for
Q29: A bacterial culture grown in a glucose-peptide
Q31: Assume you are growing bacteria on a
Unlock this Answer For Free Now!
View this answer and more for free by performing one of the following actions

Scan the QR code to install the App and get 2 free unlocks

Unlock quizzes for free by uploading documents