Multiple Choice
Figure 7.2
Assume 10⁹ E.coli cells/ml are in a flask.
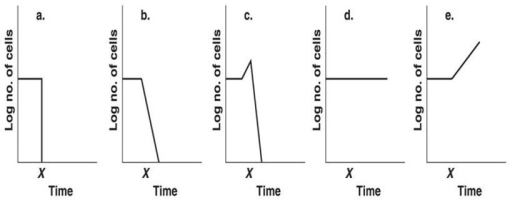
-Which graph in Figure 7.2 best depicts the effect of placing the culture at 7°C at time x?
A) a
B) b
C) c
D) d
E) e
Correct Answer:
Verified
Related Questions
Q18: The most effective form of chlorine is
Q19: All of the following substances are effective
Q20: Which of the following pairs of terms
Q21: Which of the following pairs is mismatched?
A)ionizing
Q22: Table 7.3
The following data were obtained by
Q24: Table 7.3
The following data were obtained by
Q25: Table 7.1
A disk-diffusion test using Staphylococcus
Unlock this Answer For Free Now!
View this answer and more for free by performing one of the following actions

Scan the QR code to install the App and get 2 free unlocks

Unlock quizzes for free by uploading documents