Multiple Choice
Figure 7.2
Assume 10⁹ E.coli cells/ml are in a flask.
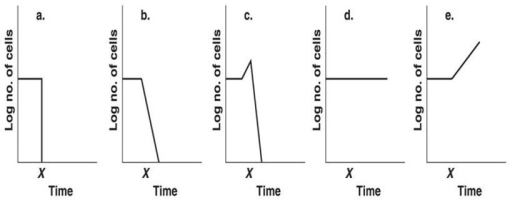
-Which graph in Figure 7.2 best depicts the effect of placing the culture in an autoclave for 15 minutes at time x?
A) a
B) b
C) c
D) d
E) e
Correct Answer:
Verified
Related Questions
Q34: Which of the following pairs is mismatched?
A)Ag
Q35: All of the following substances are used
Q36: Figure 7.1 Q37: Ethylene oxide Q38: Table 7.3
![]()
A)is a good antiseptic.
B)is not sporicidal.
C)requires
The following data were obtained by
Unlock this Answer For Free Now!
View this answer and more for free by performing one of the following actions

Scan the QR code to install the App and get 2 free unlocks

Unlock quizzes for free by uploading documents