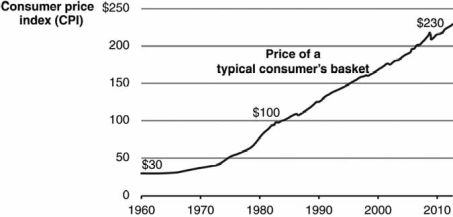
Use the graph shown to discuss, in qualitative terms, the changes in the U.S. inflation rate from 1960 to 2012. Then estimate the inflation rate in 2012.
Correct Answer:
Verified
View Answer
Unlock this answer now
Get Access to more Verified Answers free of charge
Q142: Arguably there are three reasons why the
Q143: A one-pound bag of Oreos cost 32
Q149: Describe the methodology of finding the consumer
Q152: Consider the equation %
Q153: Using the table below, compute the
Q154: Explain how to calculate the inflation rate
Q158: Explain how to convert a price in
Q166: Why would knowing the cost of living
Q169: What is the Billion Prices Project? Explain
Q172: In what two ways does the consumer
Unlock this Answer For Free Now!
View this answer and more for free by performing one of the following actions

Scan the QR code to install the App and get 2 free unlocks

Unlock quizzes for free by uploading documents