Figure 2-14 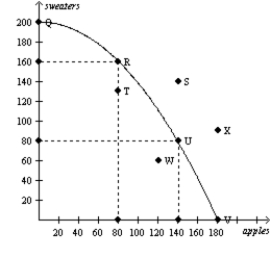 Consider the production possibilities curve for a country that can produce sweaters,apples (in bushels) ,or a combination of the two
-Refer to Figure 2-14.If this society moves from point U to point V,
A) it gives up 40 bushels of apples to get 80 sweaters.
B) it gives up 140 bushels of apples to get 80 sweaters.
C) it gives up 80 sweaters to get 140 bushels of apples.
D) it gives up 80 sweaters to get 40 bushels of apples.
Correct Answer:
Verified
Q232: Figure 2-12 Q233: Microeconomics is the study of Q234: Figure 2-15 Q235: Figure 2-15 Q236: Figure 2-12 Q238: Figure 2-11 Q239: Refer to Figure 2-13.Which points are not Q240: Macroeconomics is the study of Q241: Figure 2-16 Q242: Figure 2-16 Unlock this Answer For Free Now! View this answer and more for free by performing one of the following actions Scan the QR code to install the App and get 2 free unlocks Unlock quizzes for free by uploading documents![]()
A)how money affects![]()
![]()
![]()
![]()
A)individual decision makers.
B)international![]()
![]()

