Figure 2-21 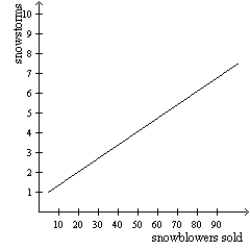
-Refer to Figure 2-21. Your friend John created the graph above to illustrate that snowstorms are caused by more snowblowers being sold. You inform him that his interpretation is incorrect due to
A) omitted variable bias.
B) reverse causality.
C) slope mismatch.
D) shifting versus moving along a curve.
Correct Answer:
Verified
Q2: According to economist John Maynard Keynes,a great
Q3: John Maynard Keynes described economics as an
Q43: Figure 2-18
Relationship between Price and Restaurant Meals
Q47: The slope of a fairly flat upward-sloping
Q51: Figure 2-18
Relationship between Price and Restaurant Meals
Q62: In the early 19th century,the Russian government
Q68: Figure 2-19
In the following graph the x-axis
Q203: In the ordered pair (3, 6), 3
Q204: Between the two ordered pairs (3, 6)
Q206: Irregular fluctuations in economic activity are known
Unlock this Answer For Free Now!
View this answer and more for free by performing one of the following actions

Scan the QR code to install the App and get 2 free unlocks

Unlock quizzes for free by uploading documents