Figure 2-19
In the following graph the x-axis shows the number of times a commuter rail train stops at a station per hour and the y-axis shows the number of commuter rail passengers per hour.
Commuter Rail Passengers by Frequency of Service 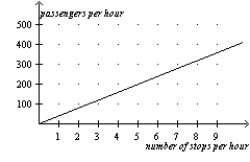
-Refer to Figure 2-19.Which of the following conclusions should not be drawn from observing this graph?
A) There is a positive correlation between the frequency of service and the number of passengers.
B) When there are 5 stops per hour,there are approximately 200 passengers.
C) More stops per hour is associated with more passengers per hour.
D) No other factors besides the frequency of service affect the number of passengers.
Correct Answer:
Verified
Q58: The slope of a line passing through
Q59: The slope of a line that passes
Q60: The slope of a line that passes
Q61: Figure 2-20
Relationship Between Years of Education and
Q62: In the early 19th century,the Russian government
Q63: The argument that purchases of minivans cause
Q64: Alfonso has noticed that increases in unemployment
Q65: Figure 2-20
Relationship Between Years of Education and
Q66: Figure 2-20
Relationship Between Years of Education and
Q67: Figure 2-19
In the following graph the x-axis
Unlock this Answer For Free Now!
View this answer and more for free by performing one of the following actions

Scan the QR code to install the App and get 2 free unlocks

Unlock quizzes for free by uploading documents