Figure 2-18
Relationship between Price and Restaurant Meals 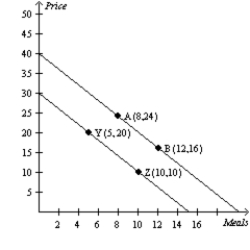
-Refer to Figure 2-18.In the ordered pair (8,24)
A) the x-coordinate is 8 and the y-coordinate is 24.
B) the x-coordinate is 24 and the y-coordinate is 8.
C) the numbers tell the location of the origin.
D) the 8 represents the price and the 24 represents the number of restaurant meals.
Correct Answer:
Verified
Q49: A relatively flat demand curve indicates that
A)quantity
Q50: Which of the following is not correct?
A)The
Q51: Figure 2-18
Relationship between Price and Restaurant Meals
Q52: Figure 2-18
Relationship between Price and Restaurant Meals
Q53: Figure 2-18
Relationship between Price and Restaurant Meals
Q55: The slope of a steep upward-sloping line
Q56: Suppose that someone makes the argument that
Q57: The slope of a line is equal
Q58: The slope of a line passing through
Q59: The slope of a line that passes
Unlock this Answer For Free Now!
View this answer and more for free by performing one of the following actions

Scan the QR code to install the App and get 2 free unlocks

Unlock quizzes for free by uploading documents