Multiple Choice
Figure 2-17 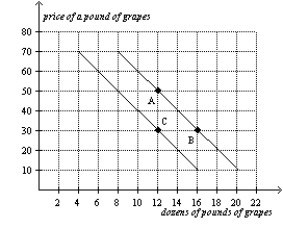
-Refer to Figure 2-17.The slope of the curve between points A and B is
A) -5
B) -1/5
C) 1/5
D) 5
Correct Answer:
Verified
Related Questions
Q21: A demand curve displaying the relationship between
Q22: Figure 2-17 Q23: A demand curve shows the relationship Q24: When two variables have a negative correlation, Q25: When two variables have a negative correlation Q27: Figure 2-17 Q28: Suppose price is measured along the vertical Q29: When two variables have a negative correlation, Q30: Figure 2-17 Q31: Figure 2-16 Unlock this Answer For Free Now! View this answer and more for free by performing one of the following actions Scan the QR code to install the App and get 2 free unlocks Unlock quizzes for free by uploading documents![]()
A)between income
A)when![]()
A)they![]()
![]()

