Multiple Choice
Figure 2-17 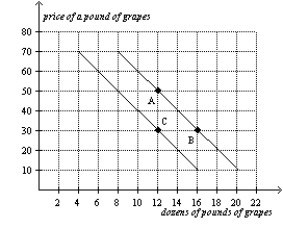
-Refer to Figure 2-17.The curves shown are
A) supply curves.
B) demand curves.
C) preference curves.
D) income-consumption curves.
Correct Answer:
Verified
Related Questions
Q22: Figure 2-17 Q23: A demand curve shows the relationship Q24: When two variables have a negative correlation, Q25: When two variables have a negative correlation Q26: Figure 2-17 Q28: Suppose price is measured along the vertical Q29: When two variables have a negative correlation, Unlock this Answer For Free Now! View this answer and more for free by performing one of the following actions Scan the QR code to install the App and get 2 free unlocks Unlock quizzes for free by uploading documents![]()
A)between income
A)when![]()
A)they

