Multiple Choice
Figure 2-16 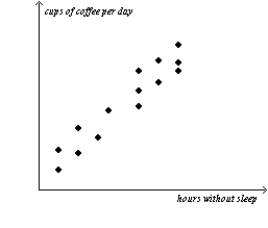
-Refer to Figure 2-16.The graph shown is known as a
A) time-series graph.
B) bar graph.
C) scatterplot.
D) pie chart.
Correct Answer:
Verified
Related Questions
Q26: Figure 2-17 Q27: Figure 2-17 Q28: Suppose price is measured along the vertical Q29: When two variables have a negative correlation, Q30: Figure 2-17 Q33: A demand curve shows the relationship between Q34: When two variables move in the same Q35: If Martina's income increases and,as a result,she Q36: Figure 2-16 Q265: When a relevant variable that is not Unlock this Answer For Free Now! View this answer and more for free by performing one of the following actions Scan the QR code to install the App and get 2 free unlocks Unlock quizzes for free by uploading documents![]()
![]()
A)they![]()
![]()

