Multiple Choice
Figure 10-9 
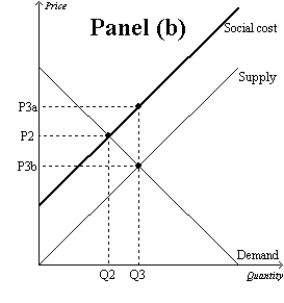
-Refer to Figure 10-9, Panel (b) and Panel (c) . The overuse of antibiotics leads to the development of antibiotic-resistant diseases. Therefore, the socially optimal quantity of antibiotics is represented by point
A) Q2.
B) Q3.
C) Q4.
D) Q5.
Correct Answer:
Verified
Related Questions

