Multiple Choice
Figure 10-2. The graph depicts the market for plastic. 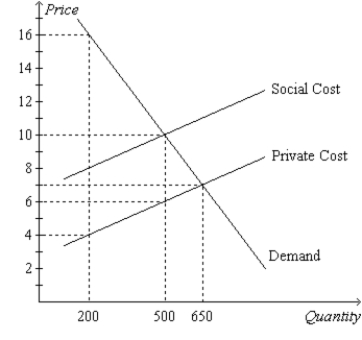
-Refer to Figure 10-2. Suppose that the production of plastic creates a social cost which is depicted in the graph above. Without any government regulation, how much plastic will be produced?
A) 200
B) 500
C) 650
D) 900
Correct Answer:
Verified
Related Questions
Q257: At any given quantity, the willingness to
Q258: Figure 10-20. Q259: A rain barrel is a container that Q260: Since air pollution creates a negative externality, Q261: This figure reflects the market for outdoor Unlock this Answer For Free Now! View this answer and more for free by performing one of the following actions Scan the QR code to install the App and get 2 free unlocks Unlock quizzes for free by uploading documents![]()
A)social

