Figure 10-1 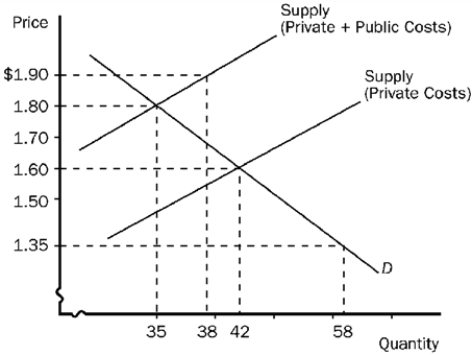
-Refer to Figure 10-1. This graph represents the tobacco industry. Without any government intervention, the equilibrium price and quantity are
A) $1.90 and 38 units, respectively.
B) $1.80 and 35 units, respectively.
C) $1.60 and 42 units, respectively.
D) $1.35 and 58 units, respectively.
Correct Answer:
Verified
Q130: Figure 10-1 Q269: Figure 10-1 Q270: Figure 10-4 Q271: Which of the following statements is correct? Q272: This figure reflects the market for outdoor Q273: Figure 10-2. The graph depicts the market Q275: Figure 10-2. The graph depicts the market Q276: Figure 10-4 Q277: The difference between social cost and private Q278: Figure 10-4 Unlock this Answer For Free Now! View this answer and more for free by performing one of the following actions Scan the QR code to install the App and get 2 free unlocks Unlock quizzes for free by uploading documents![]()
![]()
![]()
A)Government![]()
![]()

