Multiple Choice
Figure 10-1 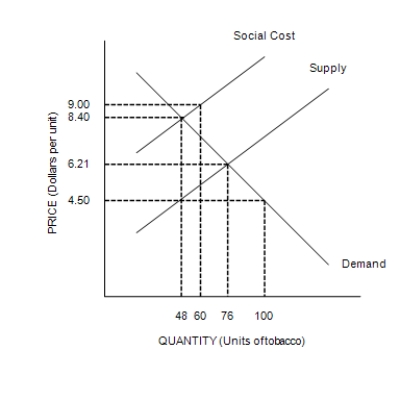
-Refer to Figure 10-1. This graph represents the tobacco industry. The industry creates
A) positive externalities.
B) negative externalities.
C) no externalities.
D) no equilibrium in the market.
Correct Answer:
Verified
Related Questions

