Multiple Choice
Figure 10-16 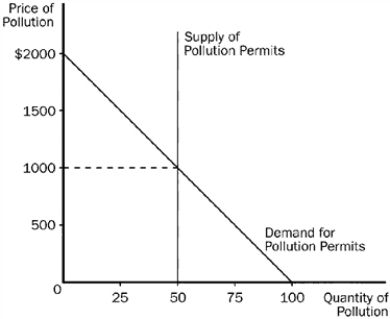
-Refer to Figure 10-16. This graph shows the market for pollution when permits are issued to firms and traded in the marketplace. The equilibrium number of permits is
A) 50
B) 100
C) 1,000
D) 2,000
Correct Answer:
Verified
Related Questions
Q211: Which of the following require firms to
Q212: Figure 10-17 Q213: Table 10-5 Q214: Two firms, A and B, each currently Q215: Two firms, A and B, each currently![]()
The following table shows the marginal
Unlock this Answer For Free Now!
View this answer and more for free by performing one of the following actions

Scan the QR code to install the App and get 2 free unlocks

Unlock quizzes for free by uploading documents