Figure 10-15 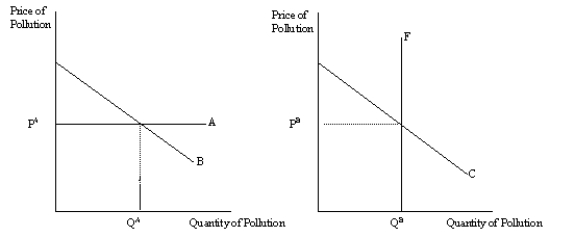
-Refer to Figure 10-15. Which graph illustrates a pollution permit program?
A) the left graph
B) the right graph
C) both graphs
D) neither graph
Correct Answer:
Verified
Q175: Figure 10-15 Q176: Figure 10-15 Q177: Suppose that elementary education creates a positive Q178: University researchers create a positive externality because Q179: University researchers create a positive externality because Q181: Which of the following is an advantage Q182: A corrective tax Q183: The difference between a corrective tax and Q184: In some cases, selling pollution permits is Q188: Which of the following is not a![]()
![]()
A)causes each factory to reduce
Unlock this Answer For Free Now!
View this answer and more for free by performing one of the following actions

Scan the QR code to install the App and get 2 free unlocks

Unlock quizzes for free by uploading documents