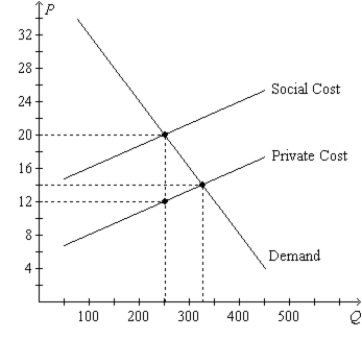
Figure 10-13. On the graph, Q represents the quantity of plastics and P represents the price of plastics. 
-Refer to Figure 10-13. In order to reach the social optimum, the government could
A) impose a tax of $2 per unit on plastics.
B) impose a tax of $6 per unit on plastics.
C) impose a tax of $8 per unit on plastics.
D) offer a subsidy of $6 per unit on plastics.
Correct Answer:
Verified
Q123: Some environmentalists argue that we should protect
Q124: Since almost all forms of transportation produce
Q125: Figure 10-13. On the graph, Q represents
Q126: Figure 10-14 Q127: Suppose that an MBA degree creates no Q129: Once tradable pollution permits have been allocated Q130: Sophia sits behind Gabriel on an airplane. Q131: If the government were to impose a Q132: A local manufacturing plant that emitted sulfur Q133: When the government uses a command-and-control policy![]()
Unlock this Answer For Free Now!
View this answer and more for free by performing one of the following actions

Scan the QR code to install the App and get 2 free unlocks

Unlock quizzes for free by uploading documents