Figure 13-3 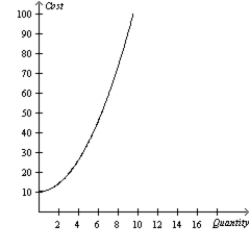
-Refer to Figure 13-3. The graph illustrates a typical total cost curve. Based on its shape, what does the corresponding production function look like?
A) an upward-sloping curve that increases at an increasing rate
B) an upward-sloping curve that increases at a decreasing rate
C) a downward-sloping curve
D) a horizontal straight line
Correct Answer:
Verified
Q449: Figure 13-3 Q450: Figure 13-3 Q451: Table 13-7 Q452: If the total cost curve gets steeper Q453: Figure 13-3 Q455: Table 13-7 Q456: Table 13-7 Q457: A total-cost curve shows the relationship between Q458: David's firm experiences diminishing marginal product for Q459: Figure 13-3 Unlock this Answer For Free Now! View this answer and more for free by performing one of the following actions Scan the QR code to install the App and get 2 free unlocks Unlock quizzes for free by uploading documents![]()
![]()
![]()
![]()
![]()
![]()
![]()

