Figure 13-2 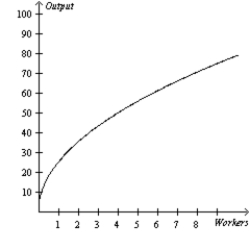
-Refer to Figure 13-2. The graph illustrates a typical production function. Based on its shape, what does the corresponding total cost curve look like?
A) an upward-sloping curve that increases at an increasing rate
B) an upward-sloping curve that increases at a decreasing rate
C) a downward-sloping curve
D) a horizontal straight line
Correct Answer:
Verified
Q194: Table 13-4
The following table shows the
Q426: Table 13-5 Q427: Table 13-4 Q428: Figure 13-2 Q429: Table 13-6 Q430: Table 13-5 Q432: Table 13-6 Q433: Table 13-4 Q435: Table 13-6 Q436: Table 13-5 Unlock this Answer For Free Now! View this answer and more for free by performing one of the following actions Scan the QR code to install the App and get 2 free unlocks Unlock quizzes for free by uploading documents![]()
Charles's Math Tutoring ![]()
![]()
Wooden Chair Factory ![]()
![]()
Wooden Chair Factory ![]()
Charles's Math Tutoring ![]()
Wooden Chair Factory ![]()
![]()

