Multiple Choice
Figure 13-2 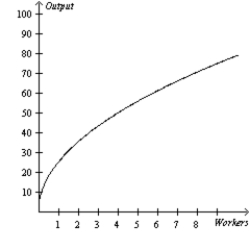
-Refer to Figure 13-2. The graph illustrates a typical
A) total-cost curve.
B) production function.
C) production possibilities frontier.
D) marginal product of labor curve.
Correct Answer:
Verified
Related Questions
Q171: Table 13-3 Q416: Table 13-3 Q417: Table 13-2 Q418: Table 13-1 Q419: On a 100-acre farm, a farmer is Q421: Table 13-5 Q422: Table 13-4 Q423: Figure 13-2 Q424: Table 13-4 Q425: Table 13-6 Unlock this Answer For Free Now! View this answer and more for free by performing one of the following actions Scan the QR code to install the App and get 2 free unlocks Unlock quizzes for free by uploading documents
![]()
![]()
![]()
![]()
Charles's Math Tutoring ![]()
![]()
Charles's Math Tutoring ![]()
Wooden Chair Factory ![]()

