Figure 1
b.
Figure 2
c.
Figure 3
d.
Figure 4
ANSWER:
d
DIFFICULTY:
Moderate
LEARNING OBJECTIVES:
ECON.MANK.174 - Given a graph of the production function and input costs, derive the firm's total-cost curve.
TOPICS:
Producer theory
Production function
KEYWORDS:
BLOOM'S: Comprehension
CUSTOM ID:
178.13.3 - MC - MANK08
Figure 13-8 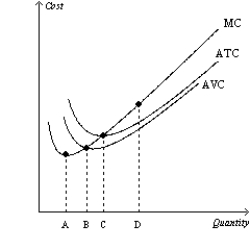
-Refer to Figure 13-8. Which of the following statements is correct?
A) Marginal cost is rising for quantities higher than D because marginal cost is higher than average total cost.
B) Average variable cost is declining for quantities less than B because marginal cost is lower than average variable cost.
C) Marginal cost is minimized at B because at that quantity, marginal cost equals average variable cost.
D) All of the above are correct.
Correct Answer:
Verified
Q222: Average total cost is very high when
Q231: Average total cost is increasing whenever
A)total cost
Q233: When marginal cost is less than average
Q343: When marginal cost is greater than average
Q344: Which of the following statements about costs
Q345: If marginal cost is equal to average
Q346: Which of the following statements is correct?
A)If
Q348: When marginal cost exceeds average total cost,
A)average
Q350: If marginal cost is below average total
Q352: Which of the following statements is not
Unlock this Answer For Free Now!
View this answer and more for free by performing one of the following actions

Scan the QR code to install the App and get 2 free unlocks

Unlock quizzes for free by uploading documents