Figure 1
b.
Figure 2
c.
Figure 3
d.
Figure 4
ANSWER:
d
DIFFICULTY:
Moderate
LEARNING OBJECTIVES:
ECON.MANK.174 - Given a graph of the production function and input costs, derive the firm's total-cost curve.
TOPICS:
Producer theory
Production function
KEYWORDS:
BLOOM'S: Comprehension
CUSTOM ID:
178.13.3 - MC - MANK08
Figure 13-8 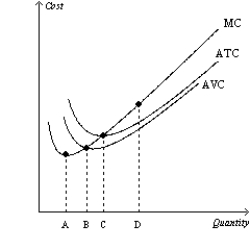
-Refer to Figure 13-8. Quantity C represents the output level where the firm
A) maximizes profits.
B) minimizes total costs.
C) produces at the efficient scale.
D) minimizes marginal costs.
Correct Answer:
Verified
Q328: Figure 13-5 Q329: Figure 13-5 Q330: Figure 13-5 Q331: Figure 13-5 Q332: Figure 1 Q334: Figure 1 Q335: Figure 1 Q336: Scenario 13-20 Q337: Figure 13-5 Q338: Figure 13-5 Unlock this Answer For Free Now! View this answer and more for free by performing one of the following actions Scan the QR code to install the App and get 2 free unlocks Unlock quizzes for free by uploading documents![]()
![]()
![]()
![]()
b.
Figure 2
c.
Figure 3
d.
Figure 4
ANSWER:
a
DIFFICULTY:
Moderate
LEARNING OBJECTIVES:
ECON.MANK.252 -
b.
Figure 2
c.
Figure 3
d.
Figure 4
ANSWER:
d
DIFFICULTY:
Moderate
LEARNING OBJECTIVES:
ECON.MANK.174 -
b.
Figure 2
c.
Figure 3
d.
Figure 4
ANSWER:
b
DIFFICULTY:
Moderate
LEARNING OBJECTIVES:
ECON.MANK.174 -
Suppose that a given firm experiences![]()
![]()

