Multiple Choice
Figure 13-5 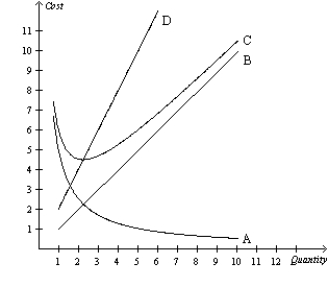
-Refer to Figure 13-5. Which curve is most likely to represent average total cost?
A) A
B) B
C) C
D) D
Correct Answer:
Verified
Related Questions
Q322: Figure 13-7 Q323: Scenario 13-20![]()
Suppose that a given firm experiences

