Figure 13-5 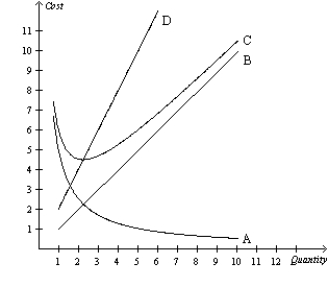
-Refer to Figure 13-5. Which of the curves is most likely to represent average fixed cost?
A) A
B) B
C) C
D) D
Correct Answer:
Verified
Q326: Figure 13-6 Q327: Figure 13-5 Q328: Figure 13-5 Q329: Figure 13-5 Q330: Figure 13-5 Q332: Figure 1 Q333: Figure 1 Q334: Figure 1 Q335: Figure 1 Q336: Scenario 13-20 Unlock this Answer For Free Now! View this answer and more for free by performing one of the following actions Scan the QR code to install the App and get 2 free unlocks Unlock quizzes for free by uploading documents![]()
![]()
![]()
![]()
![]()
b.
Figure 2
c.
Figure 3
d.
Figure 4
ANSWER:
a
DIFFICULTY:
Moderate
LEARNING OBJECTIVES:
ECON.MANK.252 -
b.
Figure 2
c.
Figure 3
d.
Figure 4
ANSWER:
d
DIFFICULTY:
Moderate
LEARNING OBJECTIVES:
ECON.MANK.174 -
b.
Figure 2
c.
Figure 3
d.
Figure 4
ANSWER:
d
DIFFICULTY:
Moderate
LEARNING OBJECTIVES:
ECON.MANK.174 -
b.
Figure 2
c.
Figure 3
d.
Figure 4
ANSWER:
b
DIFFICULTY:
Moderate
LEARNING OBJECTIVES:
ECON.MANK.174 -
Suppose that a given firm experiences

