Figure 13-10 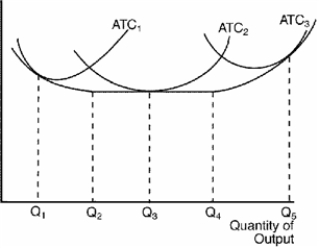
-Refer to Figure 13-10. The three average total cost curves on the diagram labeled ATC1, ATC2, and ATC3 most likely correspond to three different
A) time horizons.
B) products.
C) firms.
D) factory sizes.
Correct Answer:
Verified
Q143: Figure 13-9
The figure below depicts average total
Q144: Figure 13-9
The figure below depicts average total
Q145: Figure 13-9
The figure below depicts average total
Q146: Figure 13-9
The figure below depicts average total
Q147: Table 13-17
Consider the following table of long-run
Q149: Bubba is a shrimp fisherman who catches
Q150: Table 13-16
Listed in the table are the
Q151: Table 13-16
Listed in the table are the
Q152: Table 13-17
Consider the following table of long-run
Q153: Figure 13-10 ![]()
Unlock this Answer For Free Now!
View this answer and more for free by performing one of the following actions

Scan the QR code to install the App and get 2 free unlocks

Unlock quizzes for free by uploading documents