Table 14-1 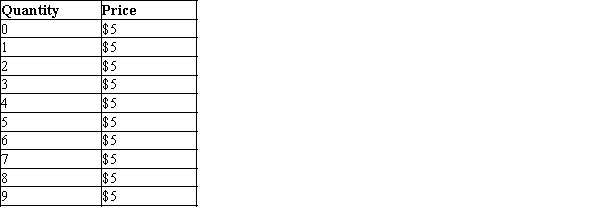
-Refer to Table 14-1. The price and quantity relationship in the table is most likely a demand curve faced by a firm in a
A) monopoly.
B) concentrated market.
C) competitive market.
D) strategic market.
Correct Answer:
Verified
Q487: Table 14-1 Q488: Table 14-1 Q489: Changes in the output of a perfectly Q490: A seller in a competitive market Q491: Which of the following firms is the Q493: A seller in a competitive market can Q494: Table 14-2 Q495: If a firm in a competitive market Q496: Table 14-1 Q497: Table 14-2 Unlock this Answer For Free Now! View this answer and more for free by performing one of the following actions Scan the QR code to install the App and get 2 free unlocks Unlock quizzes for free by uploading documents![]()
![]()
A)can sell
A)sell
The table represents a demand curve![]()
The table represents a demand curve

