Figure 14-6
Suppose a firm operating in a competitive market has the following cost curves: 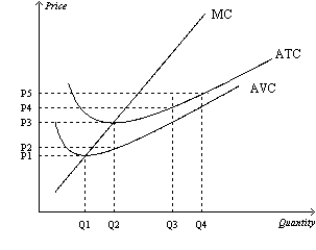
-Refer to Figure 14-6. When market price is P3, a profit-maximizing firm's total revenue
A) can be represented by the area P3 × Q3.
B) can be represented by the area P3 × Q2.
C) can be represented by the area (P3-P2) × Q3.
D) is zero.
Correct Answer:
Verified
Q361: Figure 14-5
Suppose a firm operating in a
Q362: Figure 14-4
Suppose a firm operating in a
Q363: Figure 14-6
Suppose a firm operating in a
Q364: Figure 14-3
Suppose a firm operating in a
Q365: Figure 14-4
Suppose a firm operating in a
Q367: Figure 14-4
Suppose a firm operating in a
Q368: Figure 14-5
Suppose a firm operating in a
Q369: Figure 14-6
Suppose a firm operating in a
Q370: Figure 14-3
Suppose a firm operating in a
Q371: Figure 14-5
Suppose a firm operating in a
Unlock this Answer For Free Now!
View this answer and more for free by performing one of the following actions

Scan the QR code to install the App and get 2 free unlocks

Unlock quizzes for free by uploading documents