Multiple Choice
Figure 15-4 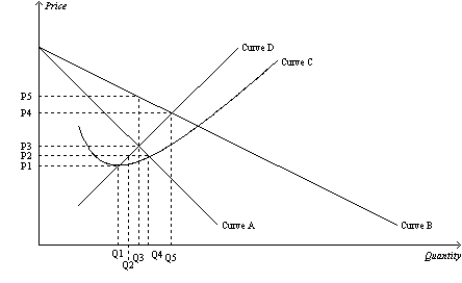
-Refer to Figure 15-4. The average total cost curve for a monopoly firm is depicted by curve
A) A.
B) B.
C) C.
D) D.
Correct Answer:
Verified
Related Questions
Figure 15-4
-Refer to Figure 15-4. The average total cost curve for a monopoly firm is depicted by curve
A) A.
B) B.
C) C.
D) D.
Correct Answer:
Verified

