Multiple Choice
Figure 15-3 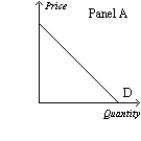

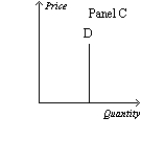
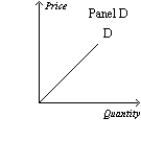
-Refer to Figure 15-3. Which panel could represent the demand curve facing the soybean industry?
A) Panel A
B) Panel B
C) Panel C
D) Panel D
Correct Answer:
Verified
Related Questions
Q341: A monopolist can sell 300 units of
Q342: Figure 15-3 Q343: Which statement best describes the effect(s) that Q344: Figure 15-3 Q345: If a monopolist's marginal costs increase by Q347: A monopoly firm can sell 150 units Q348: Figure 15-4 Q349: If a monopolist has zero marginal costs, Q350: Bob's Butcher Shop is the only place Q351: Figure 15-3 Unlock this Answer For Free Now! View this answer and more for free by performing one of the following actions Scan the QR code to install the App and get 2 free unlocks Unlock quizzes for free by uploading documents![]()
![]()
![]()
![]()

