Figure 16-1 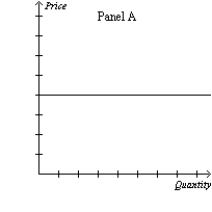
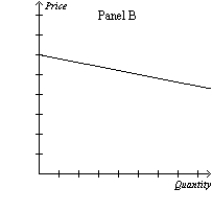
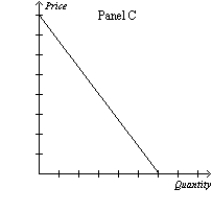
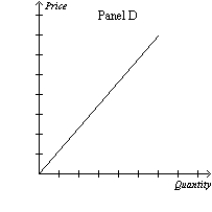
-Refer to Figure 16-1. Which of the following sets of explanations best describes the differences between the graphs above?
A) Panel A: monopolistically competitive firm's demand curve Panel B: monopoly firm's demand curve
Panel C: oligopoly firm's demand curve
Panel D: perfectly competitive firm's demand curve
B) Panel A: oligopoly firm's demand curve Panel B: perfectly competitive firm's demand curve
Panel C: monopolistically competitive firm's demand curve
Panel D: supply curve
C) Panel A: perfectly competitive firm's demand curve Panel B: monopolistically competitive firm's demand curve
Panel C: monopoly firm's demand curve
Panel D: supply curve
D) Panel A: monopolistically competitive firm's demand curve Panel B: monopoly firm's demand curve
Panel C: perfectly competitive firm's demand curve
Panel D: supply curve
Correct Answer:
Verified
Q142: When an industry has many firms, the
Q537: Which of the following is an example
Q538: A market structure in which there are
Q539: In a monopolistically competitive market,
A)there are only
Q540: Select the type of market that is
Q543: In which of the following market structures
Q544: Which of the following market structures is
Q545: Which of the following conditions distinguishes monopolistic
Q546: Figure 16-1 Q547: Of the following market structures, which are![]()
Unlock this Answer For Free Now!
View this answer and more for free by performing one of the following actions

Scan the QR code to install the App and get 2 free unlocks

Unlock quizzes for free by uploading documents