Table 16-2
The following table shows the total output produced by the top six firms as well as the total industry output for each industry. 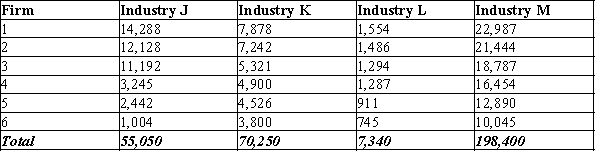
-Refer to Table 16-2. Which industry has the lowest concentration ratio?
A) Industry J
B) Industry K
C) Industry L
D) Industry M
Correct Answer:
Verified
Q504: Scenario 16-1
Suppose the following are the sales
Q505: Table 16-3
The following table shows the output
Q506: Table 16-2
The following table shows the total
Q507: Table 16-3
The following table shows the output
Q508: Table 16-2
The following table shows the total
Q510: Table 16-3
The following table shows the output
Q511: Table 16-3
The following table shows the output
Q512: Table 16-2
The following table shows the total
Q513: Table 16-2
The following table shows the total
Q514: Table 16-2
The following table shows the total
Unlock this Answer For Free Now!
View this answer and more for free by performing one of the following actions

Scan the QR code to install the App and get 2 free unlocks

Unlock quizzes for free by uploading documents