Table 16-1
The following table shows the percentage of output supplied by the top eight firms in four different industries. 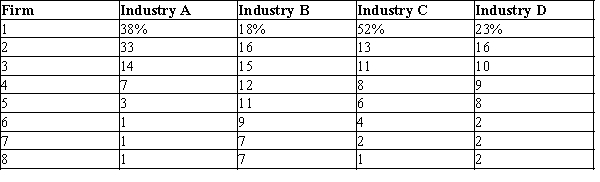
-Refer to Table 16-1. Which industry has the highest concentration ratio?
A) Industry A
B) Industry B
C) Industry C
D) Industry D
Correct Answer:
Verified
Q149: One characteristic of an oligopoly market structure
Q482: Which of the following industries has the
Q483: Table 16-1
The following table shows the percentage
Q484: The breakfast cereal industry, with its concentration
Q485: Which of the following industries has the
Q486: Table 16-1
The following table shows the percentage
Q488: An oligopoly
A)has a concentration ratio of less
Q490: The lower the concentration ratio, the
A)more control
Q491: Table 16-1
The following table shows the percentage
Q492: Crude oil is primarily supplied to the
Unlock this Answer For Free Now!
View this answer and more for free by performing one of the following actions

Scan the QR code to install the App and get 2 free unlocks

Unlock quizzes for free by uploading documents