Figure 16-11 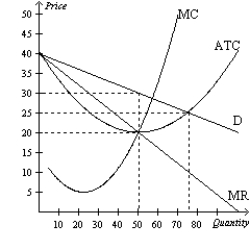
-Refer to Figure 16-11. The graph depicts a monopolistically competitive firm in the short run. Which of the following explanations best describes the long run adjustment?
A) More firms will enter this market and each firm will have a smaller share of the total market demand, shifting this firm's demand curve to the left.
B) More firms will enter this market and each firm will have a larger share of the total market demand, shifting this firm's demand to the right.
C) Firms will exit this market and each firm will have a smaller share of the total market demand, shifting this firm's demand to the left.
D) Firms will exit this market and each firm will have a larger share of the total market demand, shifting this firm's demand to the right.
Correct Answer:
Verified
Q306: Figure 16-10
The figure is drawn for a
Q307: Figure 16-10
The figure is drawn for a
Q308: Figure 16-10
The figure is drawn for a
Q309: Figure 16-9
The figure is drawn for a
Q310: Figure 16-9
The figure is drawn for a
Q312: Figure 16-10
The figure is drawn for a
Q313: Figure 16-11 Q314: Table 16-4 Q315: Figure 16-11 Q316: Figure 16-12 Unlock this Answer For Free Now! View this answer and more for free by performing one of the following actions Scan the QR code to install the App and get 2 free unlocks Unlock quizzes for free by uploading documents![]()
This table shows the demand schedule,![]()
![]()

