Figure 16-9
The figure is drawn for a monopolistically-competitive firm. 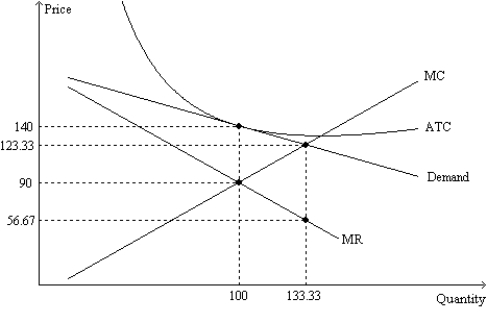
-Refer to Figure 16-9. The quantity of output at which the MC and ATC curves cross is the
A) efficient scale of the firm.
B) short-run equilibrium quantity of output for the firm.
C) long-run equilibrium quantity of output for the firm.
D) All of the above are correct.
Correct Answer:
Verified
Q305: Figure 16-10
The figure is drawn for a
Q306: Figure 16-10
The figure is drawn for a
Q307: Figure 16-10
The figure is drawn for a
Q308: Figure 16-10
The figure is drawn for a
Q309: Figure 16-9
The figure is drawn for a
Q311: Figure 16-11 Q312: Figure 16-10 Q313: Figure 16-11 Q314: Table 16-4 Q315: Figure 16-11 Unlock this Answer For Free Now! View this answer and more for free by performing one of the following actions Scan the QR code to install the App and get 2 free unlocks Unlock quizzes for free by uploading documents![]()
The figure is drawn for a![]()
This table shows the demand schedule,![]()

