Multiple Choice
Figure 16-8
The lines in the figures below illustrate the potential effect of entry and exit in a monopolistically competitive market on either the demand curve or the marginal cost curve of existing firms. 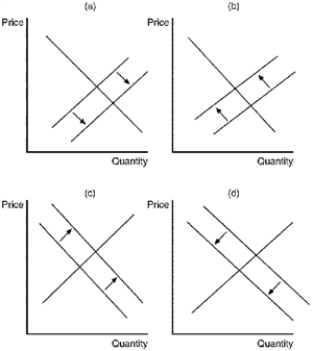
-Refer to Figure 16-8. Which of the diagrams illustrates the impact of some existing firms leaving the market?
A) panel a
B) panel b
C) panel c
D) panel d
Correct Answer:
Verified
Related Questions
Q287: Figure 16-6 Q288: Figure 16-5 Q289: Figure 16-6 Q290: Figure 16-9![]()
![]()
![]()
The figure is drawn for a

