Figure 16-8
The lines in the figures below illustrate the potential effect of entry and exit in a monopolistically competitive market on either the demand curve or the marginal cost curve of existing firms. 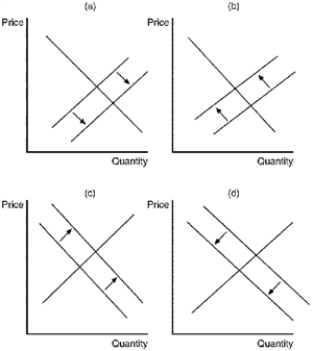
-Refer to Figure 16-8. Panel (d) illustrates the change that would occur if existing firms faced
A) long-run economic losses.
B) a decrease in the diversity of products offered in the market.
C) new entrants in the market.
D) firms exiting the market.
Correct Answer:
Verified
Q293: Figure 16-7 Q294: Figure 16-5 Q295: Figure 16-5 Q296: Figure 16-9 Q297: Figure 16-9 Unlock this Answer For Free Now! View this answer and more for free by performing one of the following actions Scan the QR code to install the App and get 2 free unlocks Unlock quizzes for free by uploading documents![]()
![]()
![]()
The figure is drawn for a
The figure is drawn for a

