Figure 16-2. The figure is drawn for a monopolistically competitive firm.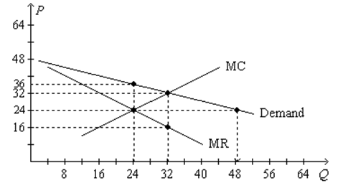
-Refer to Figure 16-2. Suppose you were to add the ATC curve to the diagram to show the firm in a situation of long-run equilibrium. You would draw the ATC curve
A) with its minimum at the point (Q = 24, P = $36) .
B) with its minimum at the point (Q = 24, P = $24) .
C) tangent to the demand curve at the point (Q = 24, P = $36) .
D) tangent to the demand curve at the point (Q = 32, P = $32) .
Correct Answer:
Verified
Q265: Figure 16-3
This figure depicts a situation in
Q266: Figure 16-4 Q267: Figure 16-2. The figure is drawn for Q268: Figure 16-4 Q269: Figure 16-3 Q271: Figure 16-3 Q272: Figure 16-2. The figure is drawn for Unlock this Answer For Free Now! View this answer and more for free by performing one of the following actions Scan the QR code to install the App and get 2 free unlocks Unlock quizzes for free by uploading documents![]()
![]()
This figure depicts a situation in
This figure depicts a situation in

