Figure 18-5 The Figure Shows a Particular Profit-Maximizing, Competitive Firm's Value-Of-Marginal-Product (VMP)
Figure 18-5
The figure shows a particular profit-maximizing, competitive firm's value-of-marginal-product (VMP) curve. On the horizontal axis, L represents the number of workers. The time frame is daily. 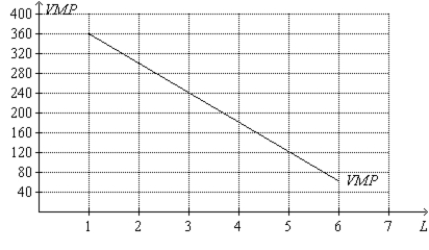
-Refer to Figure 18-5. Suppose one point on the firm's production function is (L = 3, Q = 180) , where L = number of workers and Q = quantity of output. If the firm sells its output for $5 per unit, then
A) a second point on the firm's production function is (L = 4, Q = 216) .
B) the firm's production function exhibits the property of diminishing marginal product of labor.
C) the firm will maximize profit by hiring four workers if it pays workers $160 per day.
D) All of the above are correct.
Correct Answer:
Verified
Q511: Table 18-B
Consider the following daily production data
Q512: Labor-augmenting technology causes which of the following?
Q513: Figure 18-5
The figure shows a particular profit-maximizing,
Q514: Table 18-B
Consider the following daily production data
Q515: Table 18-B
Consider the following daily production data
Q517: Figure 18-4
The graph below illustrates the market
Q518: In 2015, the total income of all
Unlock this Answer For Free Now!
View this answer and more for free by performing one of the following actions

Scan the QR code to install the App and get 2 free unlocks

Unlock quizzes for free by uploading documents