Figure 18-5 The Figure Shows a Particular Profit-Maximizing, Competitive Firm's Value-Of-Marginal-Product (VMP)
Figure 18-5
The figure shows a particular profit-maximizing, competitive firm's value-of-marginal-product (VMP) curve. On the horizontal axis, L represents the number of workers. The time frame is daily. 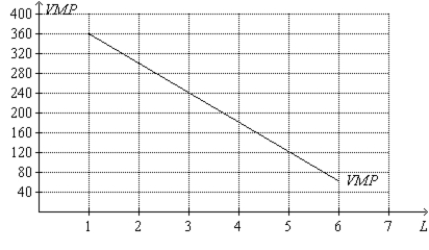
-Refer to Figure 18-5. The value-of-marginal-product curve that is drawn could be relabeled as the firm's
A) production function.
B) total revenue curve.
C) labor supply curve.
D) labor demand curve.
Correct Answer:
Verified
Q503: Table 18-B
Consider the following daily production data
Q504: Suppose a labor-augmenting technology were developed for
Q505: A consultant interviews the hiring manager of
Q506: Figure 18-4
The graph below illustrates the market
Q507: Table 18-B
Consider the following daily production data
Q509: A consultant interviews the hiring manager of
Q510: Figure 18-5
The figure shows a particular profit-maximizing,
Q511: Table 18-B
Consider the following daily production data
Q512: Labor-augmenting technology causes which of the following?
Q513: Figure 18-5
The figure shows a particular profit-maximizing,
Unlock this Answer For Free Now!
View this answer and more for free by performing one of the following actions

Scan the QR code to install the App and get 2 free unlocks

Unlock quizzes for free by uploading documents