Figure 18-2
The figure below shows the production function for a particular firm. 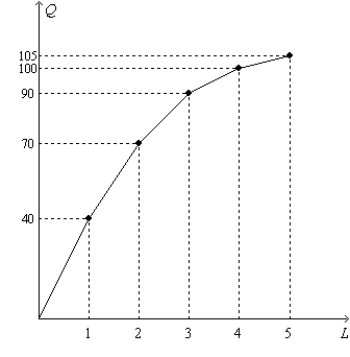
-Refer to Figure 18-2. The marginal product of the third worker is
A) 20 units.
B) 30 units.
C) 40 units.
D) 70 units.
Correct Answer:
Verified
Q361: Figure 18-1
On the graph, L represents the
Q362: Figure 18-2
The figure below shows the production
Q363: Figure 18-2
The figure below shows the production
Q364: Figure 18-1
On the graph, L represents the
Q365: Figure 18-1
On the graph, L represents the
Q367: Figure 18-1
On the graph, L represents the
Q368: Figure 18-1
On the graph, L represents the
Q369: Figure 18-1
On the graph, L represents the
Q370: Figure 18-3 Q371: Figure 18-3 ![]()
![]()
Unlock this Answer For Free Now!
View this answer and more for free by performing one of the following actions

Scan the QR code to install the App and get 2 free unlocks

Unlock quizzes for free by uploading documents