Multiple Choice
Figure 18-1
On the graph, L represents the quantity of labor and Q represents the quantity of output per week. 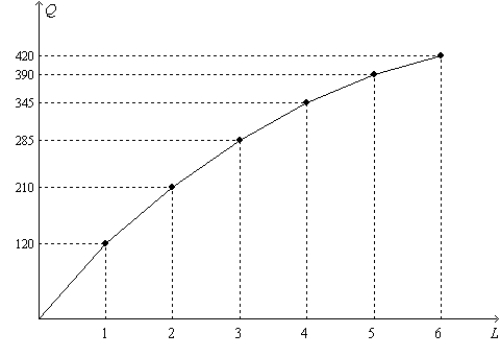
-Refer to Figure 18-1. Based on the shape of the curve, the
(i) total product is increasing.
(ii) total product is decreasing.
(iii) marginal product is increasing.
(iv) marginal product is decreasing.
A) (i) only
B) (i) and (iii) only
C) (i) and (iv) only
D) (ii) and (iv) only
Correct Answer:
Verified
Related Questions

