Figure 18-6 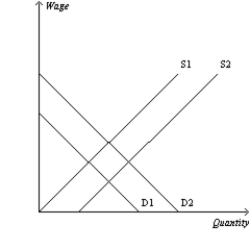
-Refer to Figure 18-6. The graph above illustrates the market for bakers who make homemade breads and breakfast pastries in Northern Minnesota. If Northern Minnesota experiences an increase in immigration from Canada, what happens in the market for bakers?
A) Demand increases from D1 to D2.
B) Demand decreases from D2 to D1.
C) Supply increases from S1 to S2.
D) Supply decreases from S2 to S1.
Correct Answer:
Verified
Q196: Your college roommate receives a pay raise
Q236: Suppose an increase in the demand for
Q237: Which of the following statements is correct?
A)Neither
Q238: Scenario 18-3
Sam has two jobs, one for
Q240: Both theory and history point to a
Q242: Among the people who are characterized below,
Q243: If the wages of a CPA decrease,
Q244: If the wages of a dentist increase,
A)so
Q245: Miguel receives a pay raise at his
Q246: Figure 18-6 ![]()
Unlock this Answer For Free Now!
View this answer and more for free by performing one of the following actions

Scan the QR code to install the App and get 2 free unlocks

Unlock quizzes for free by uploading documents